Chrome DevTools for agents
Chrome DevTools for agents
By Dave Bitter
5 min read
Google I/O Connect Berlin and the GDE Europe Summit showed how coding agents can drive Chrome directly through chrome-devtools-mcp, and how Modern Web Guidance keeps agents from reaching for stale patterns in the first place.
- Authors

- Name
- Dave Bitter
I just got back from Berlin after two days at Google events: I/O Connect Berlin 2026 at Wilhelm Studios and the GDE Europe Summit at the Google Berlin office. I was there as a Google Developer Expert (GDE) for Web together with Brecht De Ruyte.
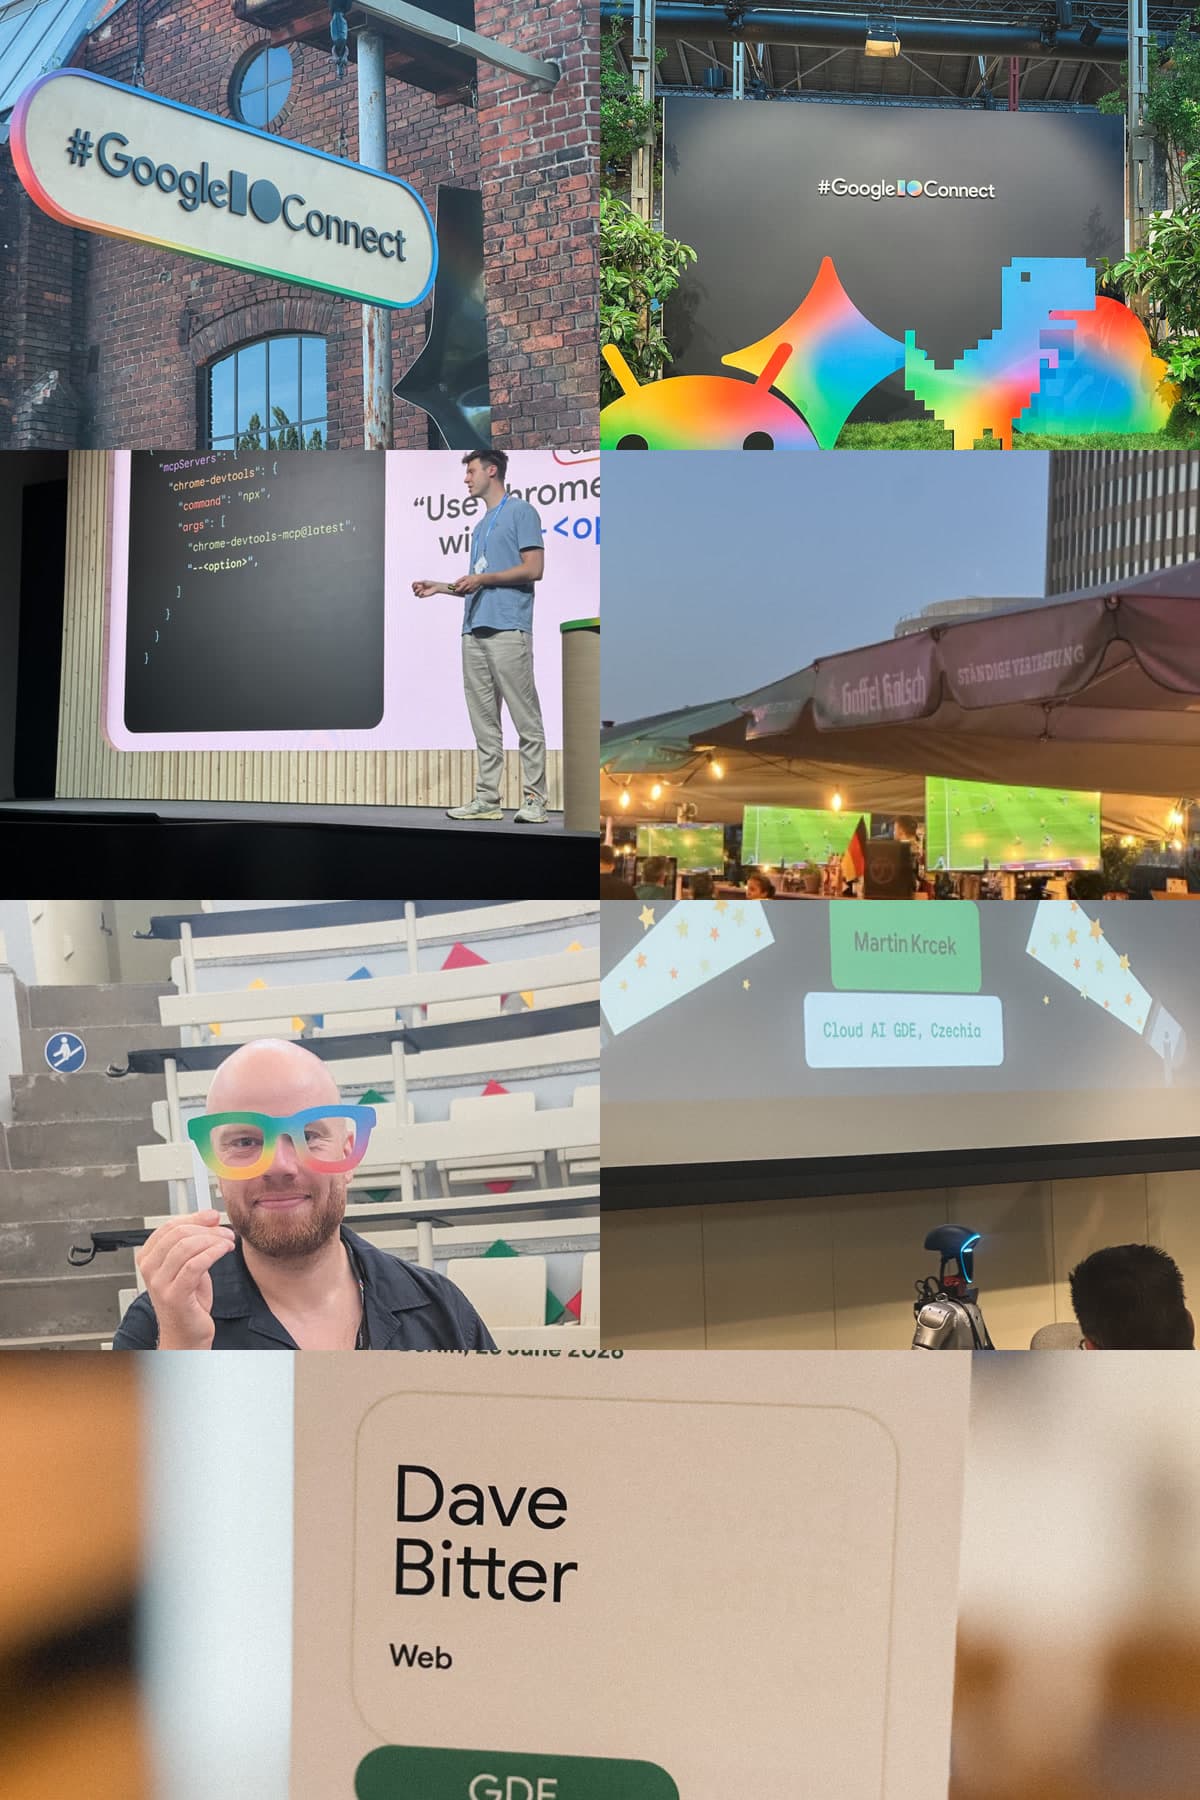
Still unpacking, but the highlight for me was clear: a coding agent opened Chrome, read the console, inspected a performance trace, and fixed a bug. No copy-pasting. No switching windows.
This post covers the two tools that stood out: Chrome DevTools for agents and Modern Web Guidance.
The problem these tools address
The familiar workflow when using a coding agent goes something like: write a prompt, agent generates code, you run it in the browser, something breaks, you copy the error, paste it back to the agent, it fixes that, something else breaks. Repeat.
The agent is essentially blind to what happens after it writes code. You become the relay between browser and agent, manually ferrying console output back and forth. The sessions framed this as one of the core friction points in AI-assisted development right now. The tools shown were a direct response.
Chrome DevTools for agents
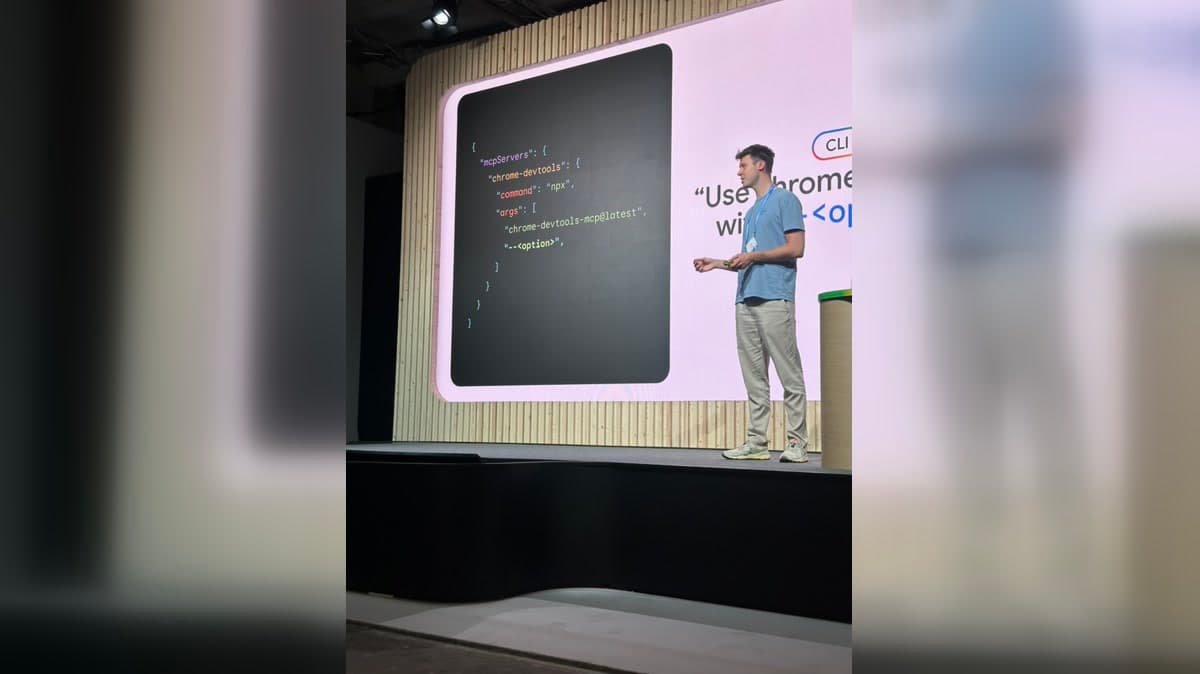
The main announcement for me was chrome-devtools-mcp, an open-source MCP server that connects a coding agent to a live Chrome browser instance using the Model Context Protocol.
Once installed, the agent can read console output directly (errors, warnings, logs) without you touching the browser. It can inspect network traffic, record and evaluate performance traces to find long tasks and INP issues, run Lighthouse audits and act on the results, and walk the accessibility tree.
The demo shown in the sessions had an agent check performance on a page, identify a long task blocking the main thread, trace it to a specific function, and propose a fix using scheduler.yield. All from a single prompt, with the agent driving Chrome directly.
The useful part for day-to-day work is that the agent can actually verify its own output. It writes code, opens the page, checks whether the console is clean, looks at what rendered, and iterates from there.
Auto-connecting to an existing session
One of the more practical things shown was the auto-connect mode (Chrome 144+). By default the MCP server spawns a fresh Chrome instance, but with --autoConnect you can point it at a browser session that's already open: one that's already logged in, already has state, already has the page you're debugging loaded.
The caveat was made clear in the sessions: when you auto-connect, the agent inherits your active session including cookies and authenticated state. Treat it like handing someone your unlocked laptop. Worth it for debugging, worth knowing about before you use it.
Manual connection via remote debugging port is also possible for sandboxed environments:
# Start Chrome with debugging port
/Applications/Google\ Chrome.app/Contents/MacOS/Google\ Chrome \
  --remote-debugging-port=9222 \
  --user-data-dir=/tmp/chrome-profile-stable
Then configure the MCP server to connect to it:
{
  "mcpServers": {
    "chrome-devtools": {
      "command": "npx",
      "args": ["chrome-devtools-mcp@latest", "--browser-url=http://127.0.0.1:9222"]
    }
  }
}
Installing it
For Claude Code:
/plugin marketplace add ChromeDevTools/chrome-devtools-mcp
/plugin install chrome-devtools-mcp@chrome-devtools-plugins
For any MCP-compatible agent (Gemini CLI, Cursor, Copilot, Cline, etc.):
{
  "mcpServers": {
    "chrome-devtools": {
      "command": "npx",
      "args": ["-y", "chrome-devtools-mcp@latest"]
    }
  }
}
Headless mode is available too if you want the agent running browser checks in the background without a visible window; add --headless to the args.
Testing the setup
The sessions suggested a quick verification prompt once installed:
Check the performance of https://developers.chrome.com
If it's working, the agent opens a browser window and records a trace. If something is off with the setup, the DevTools troubleshooting skill can be invoked directly:
Use the Chrome DevTools troubleshooting skill to fix my setup.
The companion piece: Modern Web Guidance
The sessions also covered Modern Web Guidance, a separate skill targeting a different part of the same problem. Chrome DevTools for agents handles debugging and verification in the browser. Modern Web Guidance handles the code quality side, giving agents up-to-date guidance on modern web platform features so they stop reaching for outdated patterns in the first place.
The short version: AI agents default to outdated patterns because their training data is stale. Modern Web Guidance is a skill file that instructs the agent to lazily fetch current guidance via the modern-web-guidance CLI when it needs to know how to approach something. An internal benchmark showed a 37 percentage point improvement in how consistently agents use modern platform features when equipped with it.
Install for Claude Code:
/plugin marketplace add GoogleChrome/modern-web-guidance
/plugin install modern-web-guidance@googlechrome
/reload-plugins
It integrates with Baseline, the W3C initiative that classifies web features by browser support. Set a target in your CLAUDE.md:
This project's Baseline target is Baseline 2024.
The agent then only suggests features within that window and adds fallbacks where needed.
Both together
The sessions presented these two tools as a pair. Modern Web Guidance reduces the chance of stale or broken code. Chrome DevTools for agents catches and fixes what still goes wrong, without the developer acting as a messenger. Neither is a complete solution on its own. Together they address the debugging loop from both ends.
At the time of writing both are in early preview, but the chrome-devtools-mcp repository is already active and the official get started guide has instructions for every major agent.